Not all products are supported by the viewer, and not all accounts have its full functionality
enabled. In general, for new accounts only data subscriptions will
be available.
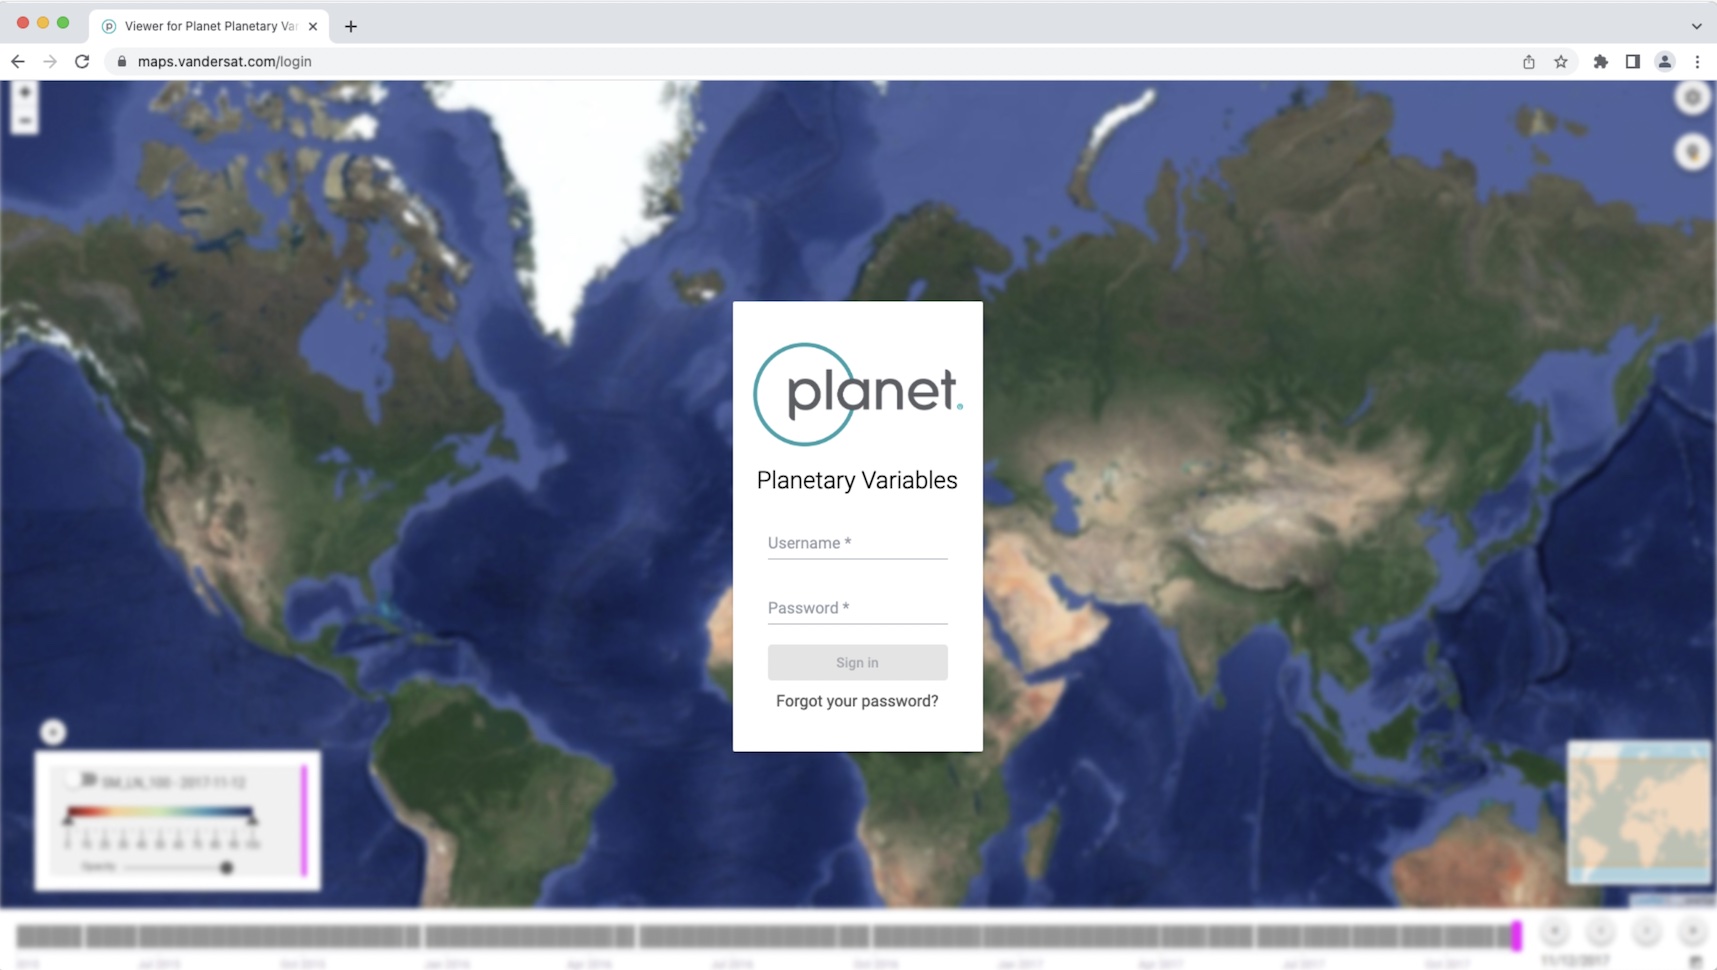
Access the Viewer by going to https://maps.vandersat.com in a supported browser (Google Chrome or Mozilla Firefox). Log in with your username and password.
After you log in for the first time, a world map centered over the configured default
region of interest with the latest date of your default product is shown.
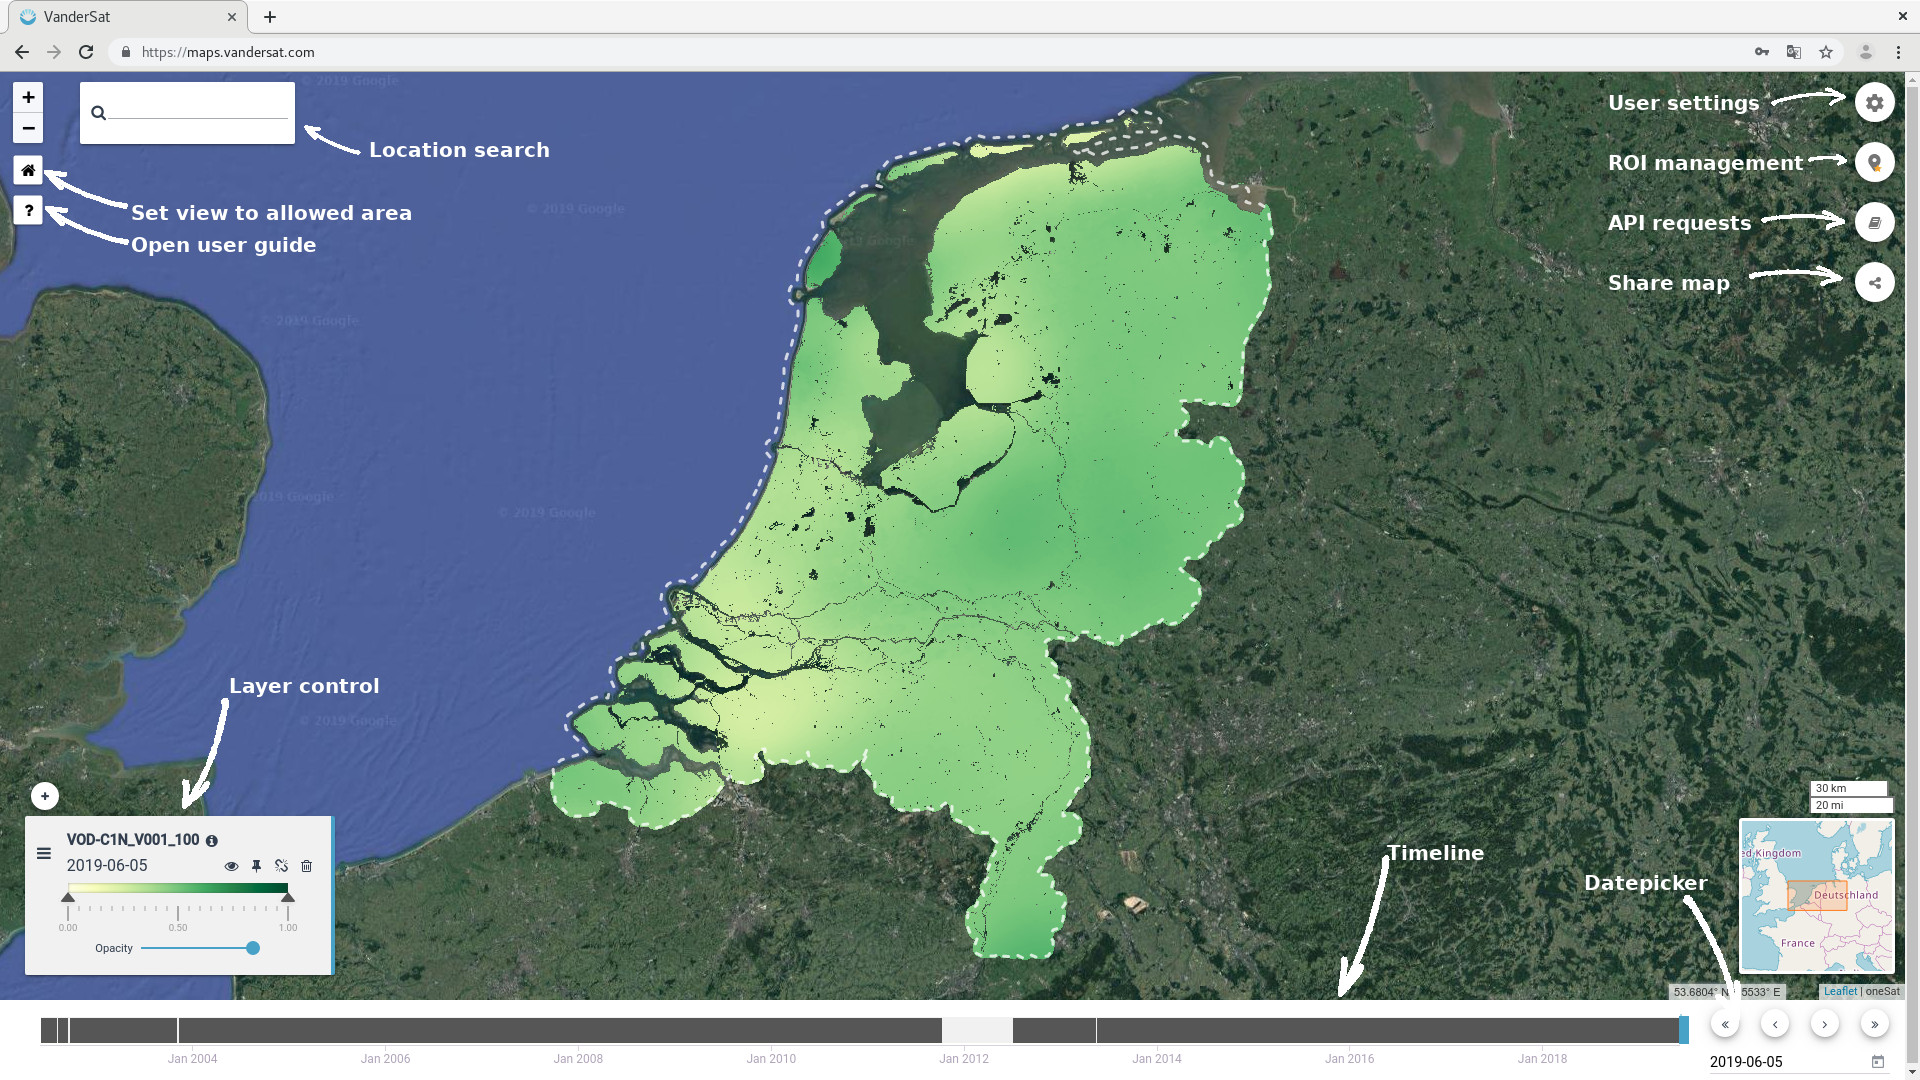
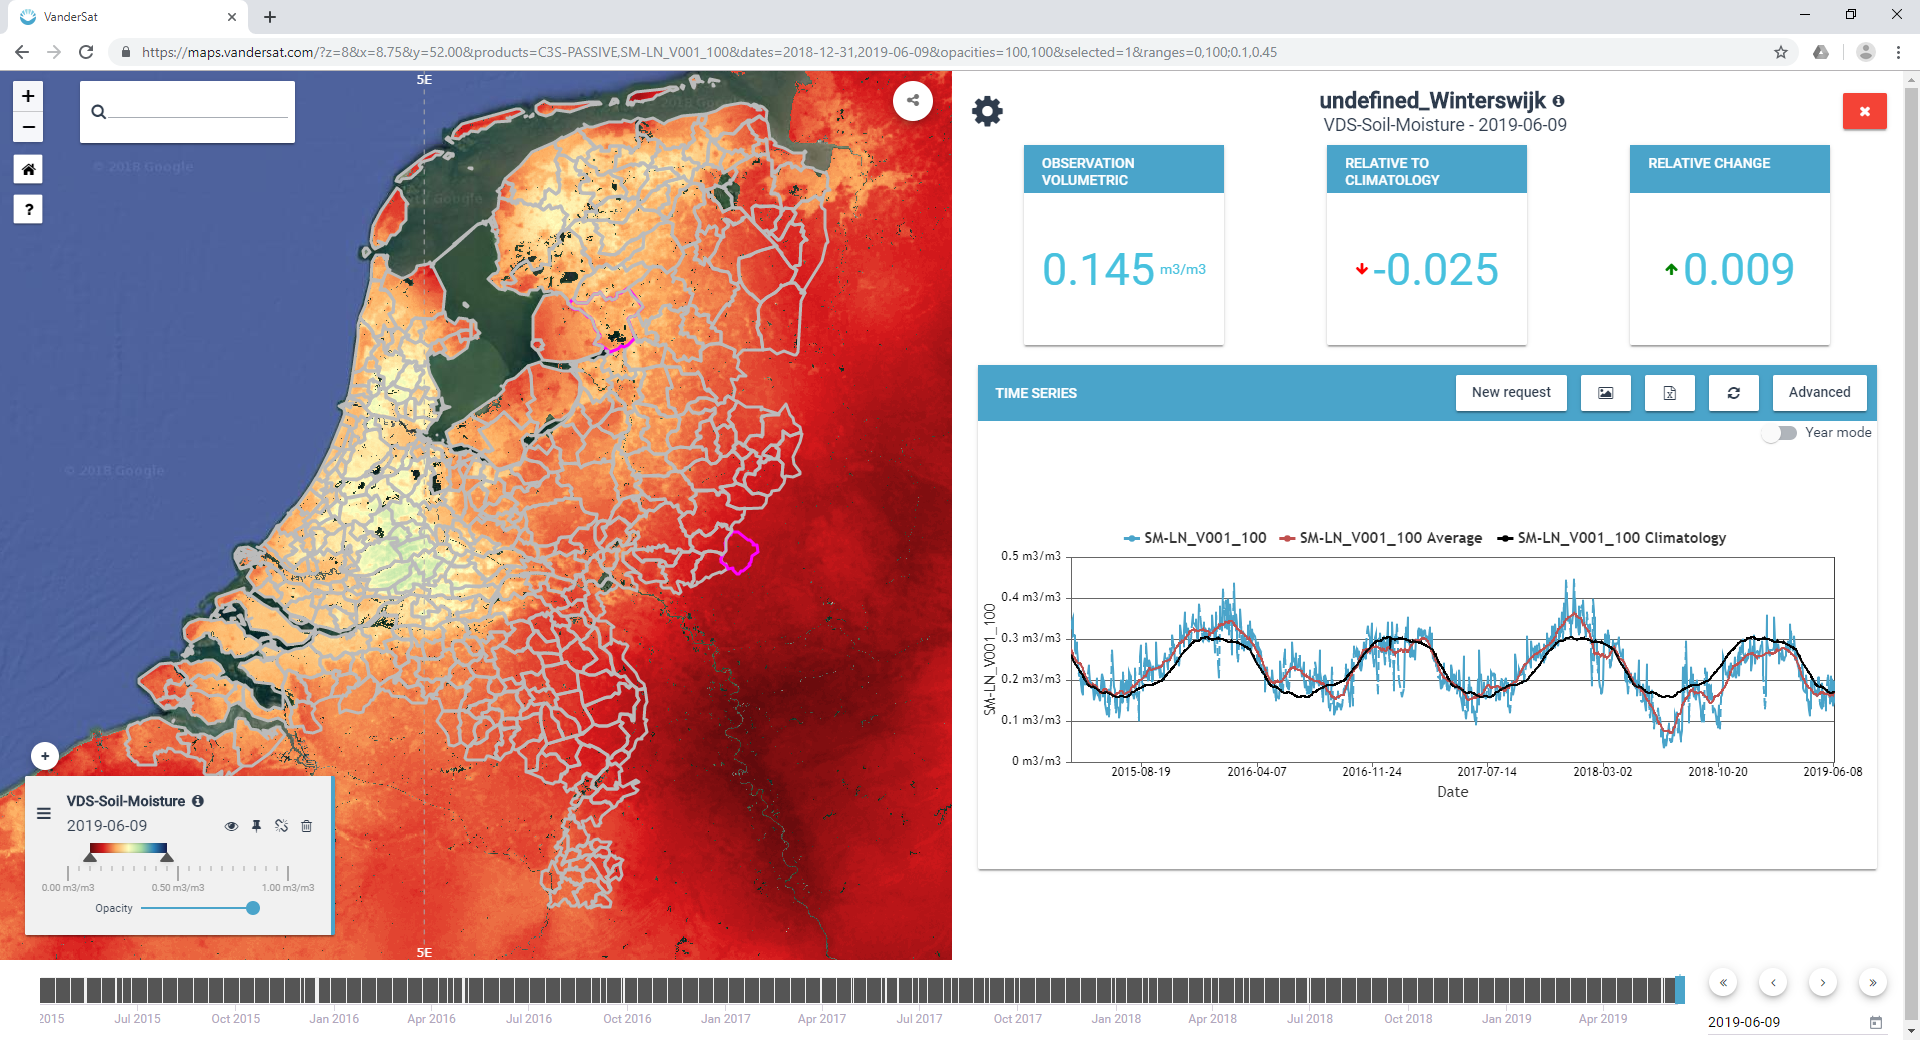
An example screen with the main controls is shown below:
The panel on the top left of the screen can be used to search for a specific location on the map
using the Google search engine. If found, the screen will be centered on that location.
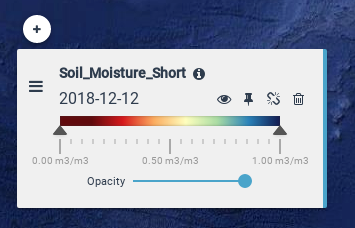
To add a layer (different product and/or dates), click on the
+ button located on top of the currently displayed layers. Please note
that the currently selected layer is highlighted with a blue bar on its
right border.
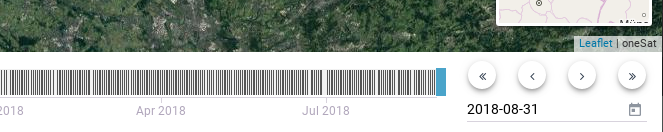
To load a different date for the selected product, you can either use the time
slider on the bottom and click on the desired date (please note that you can
zoom in and out of the time slider to change the displayed range by using the
wheel of your mouse) or manually specify the date in the calendar on the
right of the slider.
Use split screen mode to compare multiple product layers. For example, you can
compare different times of one product or different products for the same time.
To enter split screen mode, drag one of the layers to the right part of the
screen.
While in split screen mode, enter “spy” mode by clicking on the button above the
right layer. In this mode, the layer on the right side is only shown within a
size-adjustable square that you can drag around with the mouse.
Creating single point time-series graphs on the fly
Click on a valid data point on the map to get the exact longitude, latitude, and
product value. It is then possible to create a time series for this point. After
selecting to draw the time series, the drawing starts between the selected start
and end date, and percentage of completion as well as the estimated time
remaining is displayed.
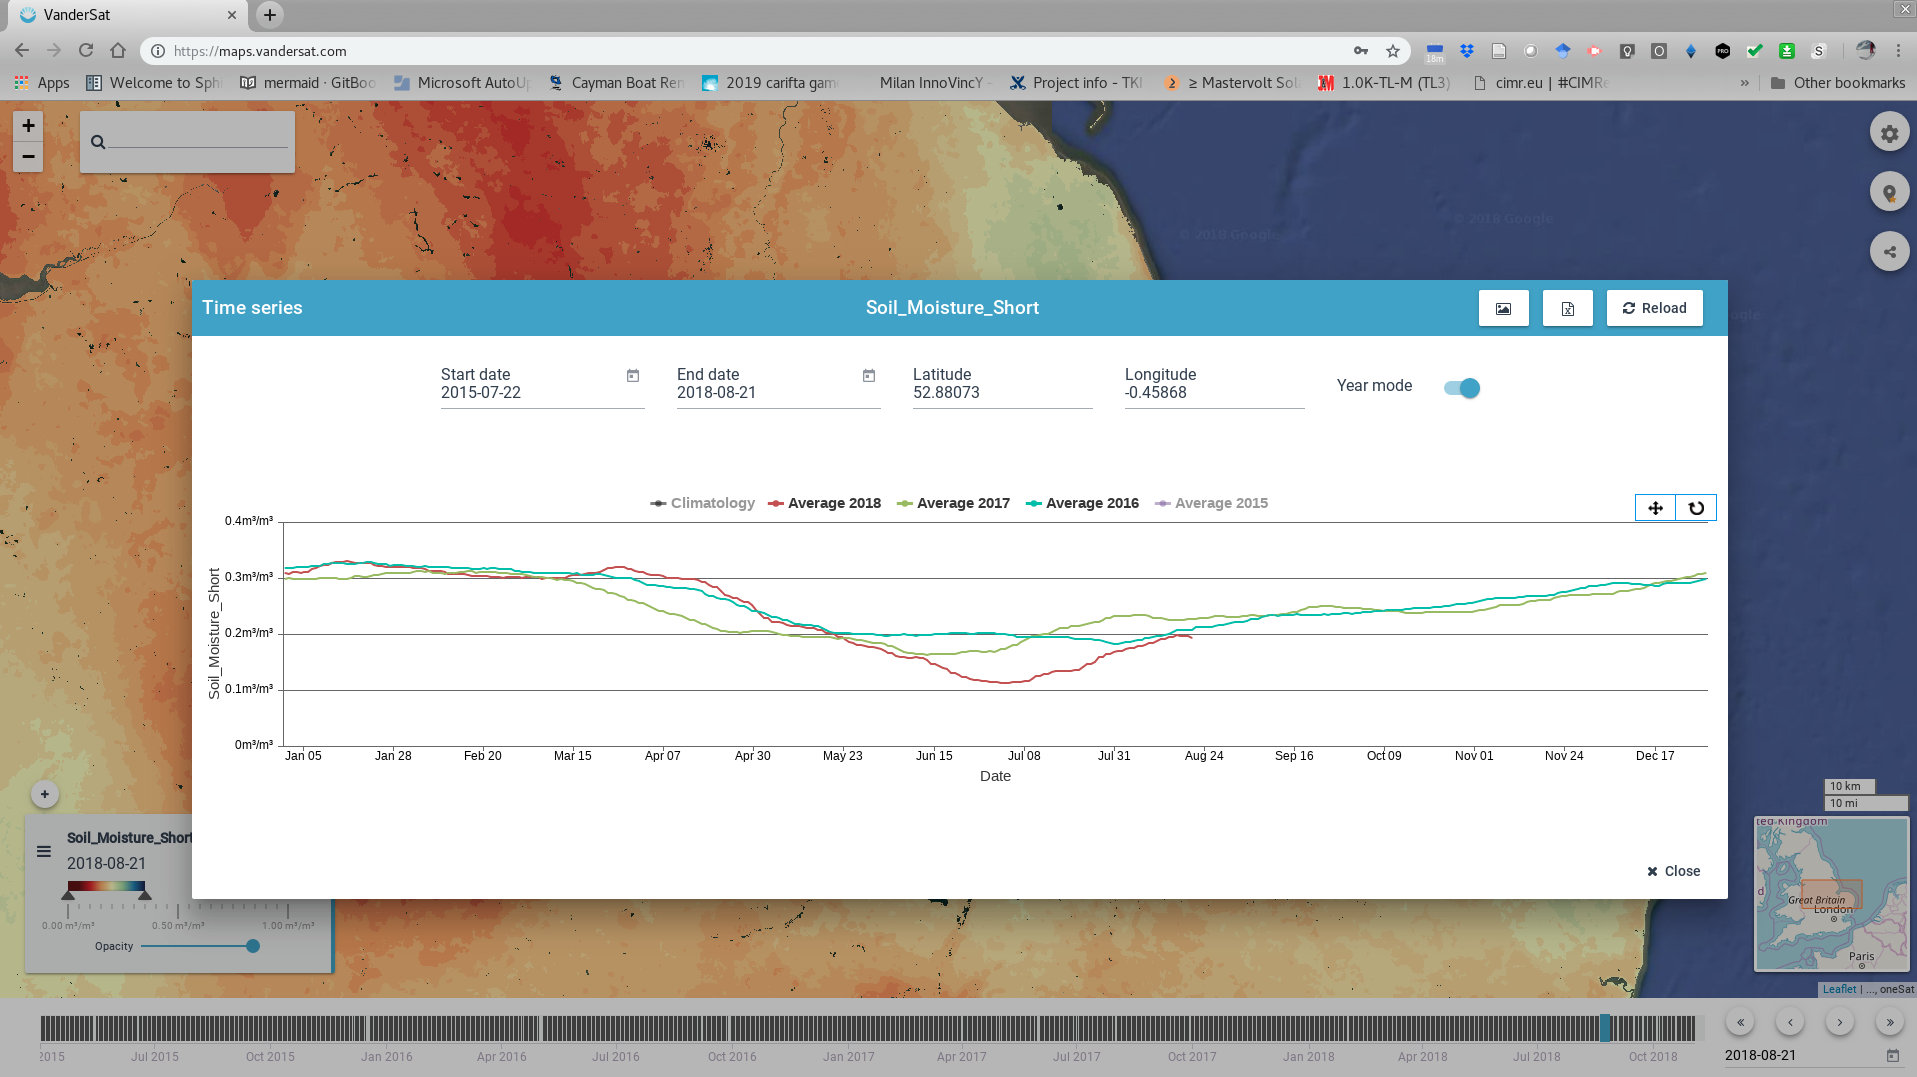
After the time series is completely drawn, a line of the moving average is
added. Click on the Year button to plot individual years on top of each other.
Time series graph of a single pixel with the graph switched to year mode
Displaying a time-series for a region of interest
If you click on a point within a region of interest (ROI), you can also choose to view an ROI Information a time
series of the average value of the ROI. ROI timeseries are not generated
on-the-fly but updated once a day in the background.
After selecting to show the dashboard, KPIs are shown for the selected
date. Moreover, the time series corresponding to the ROI is also drawn.
The time series for the ROI is drawn as well as the centered moving
average +/- 20 days for this ROI (smoothed signal) available until the
last 20 days, and the climatology built from the same +/-20 days
smoothed signal.
The following KPI’s are currently shown for the selected date:
Data quality (%):
Represents the percentage of data usable for the ROI
Observation Volumetric (m3/m3):
Represents the current daily observation
Relative to Climatology (m3/m3):
Represents the difference between the selected date value and the climatology value at the same day of the year
Relative Change (m3/m3):
Represents the variation compared to the last observation.
Figure showing the key performance indicators in a region of
interest
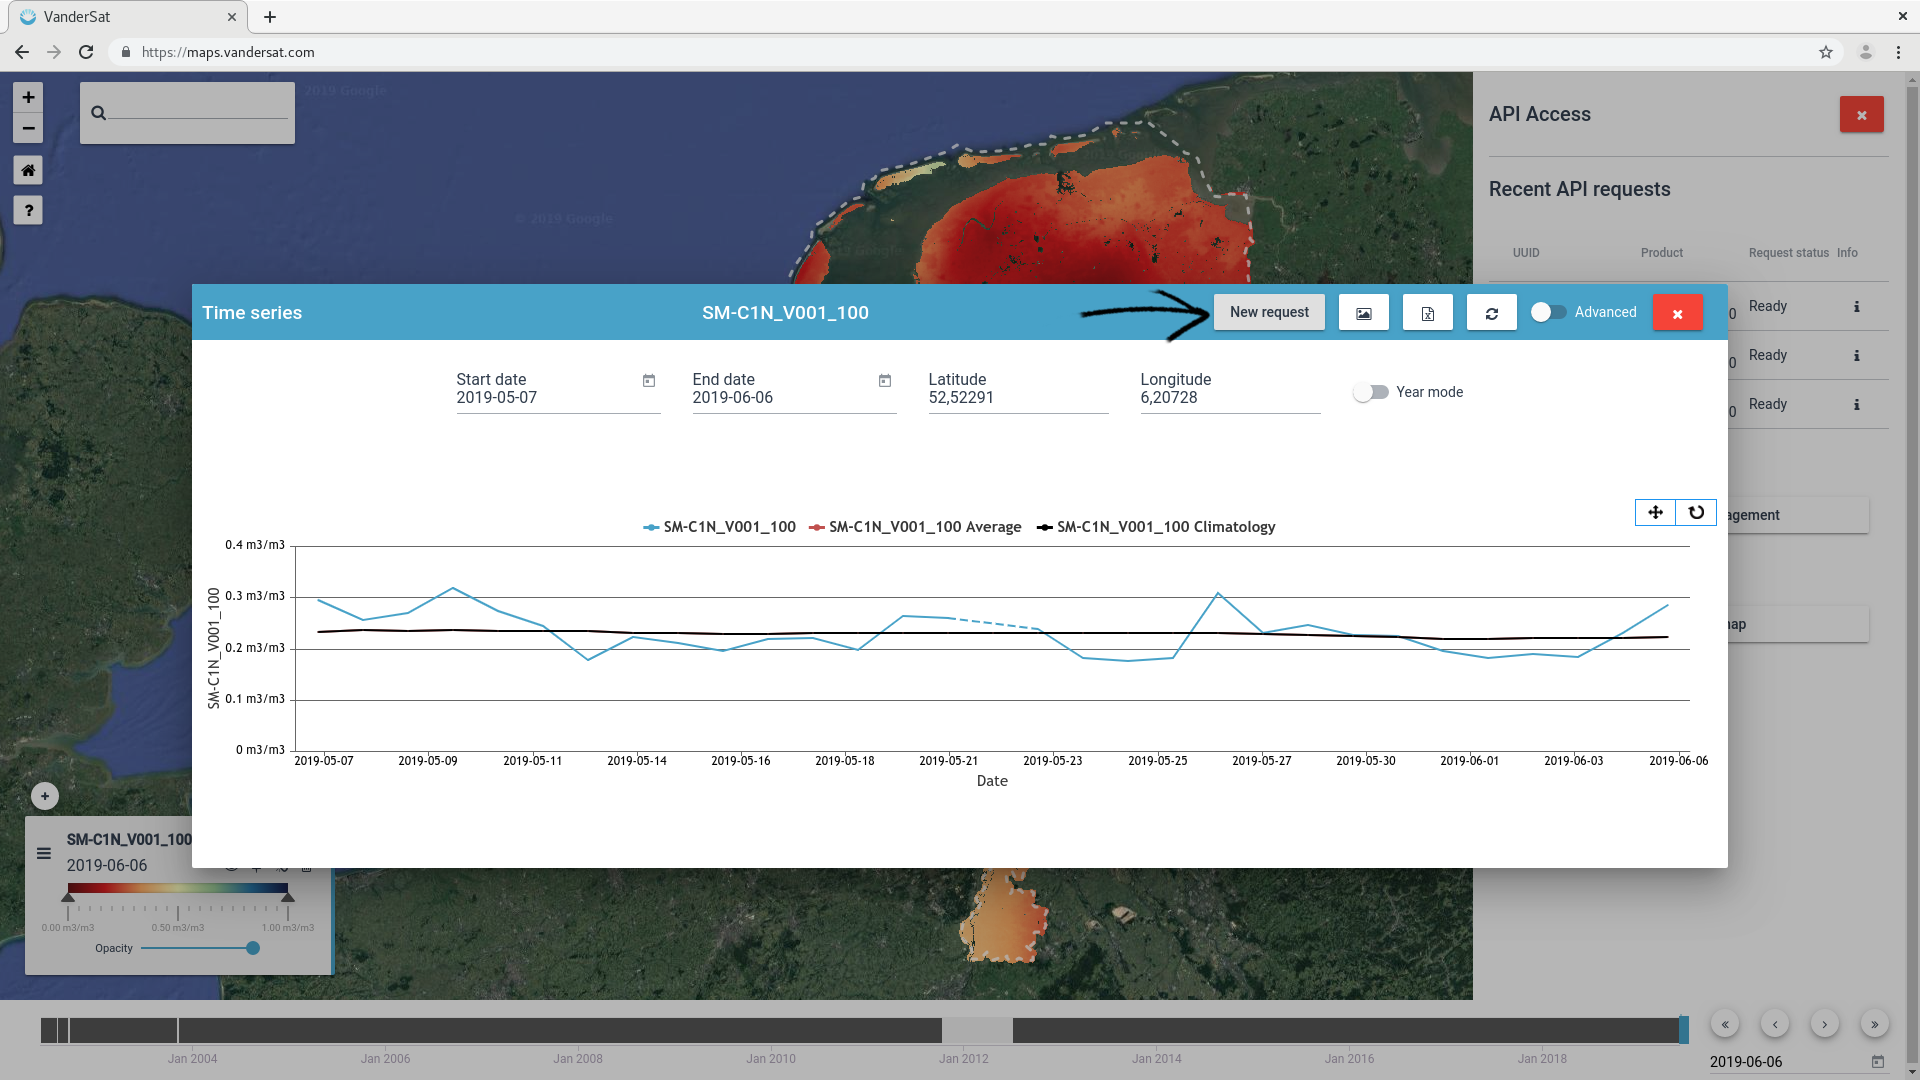
Specific time series request can be made clicking on the New request button in
the time series window. A popup to set the parameters of the request will show
up. Afterwards you can check the status of the request and retrieve the
information through the API Access menu on the right, shown when clicking the
API access button.
API request creation and checking it on the API access sidenav afterwards
A list with all the API requests can also be found on the API access menu, after
clicking the API request management button. The list can be filtered. The
current status of the processing for the request can be seen and refreshed from
the list. If there’s a file related with a request you can download it.
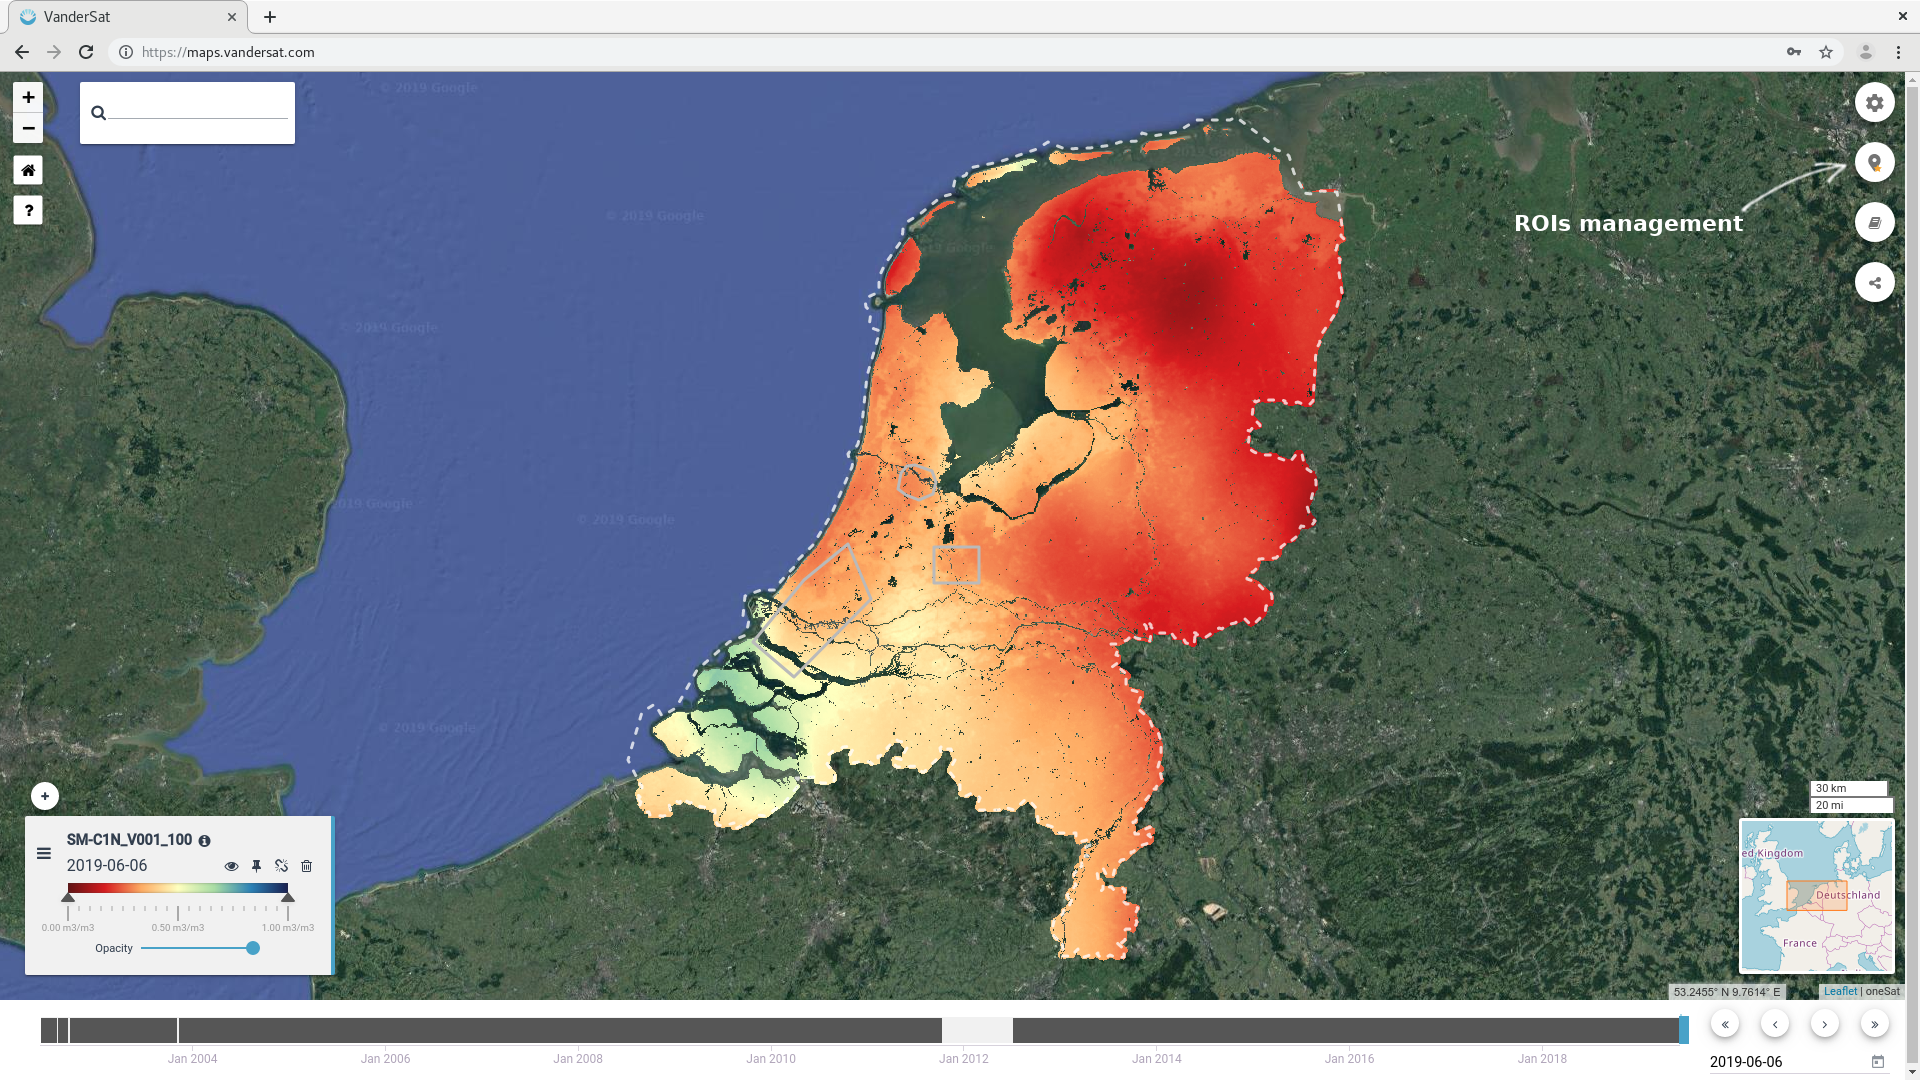
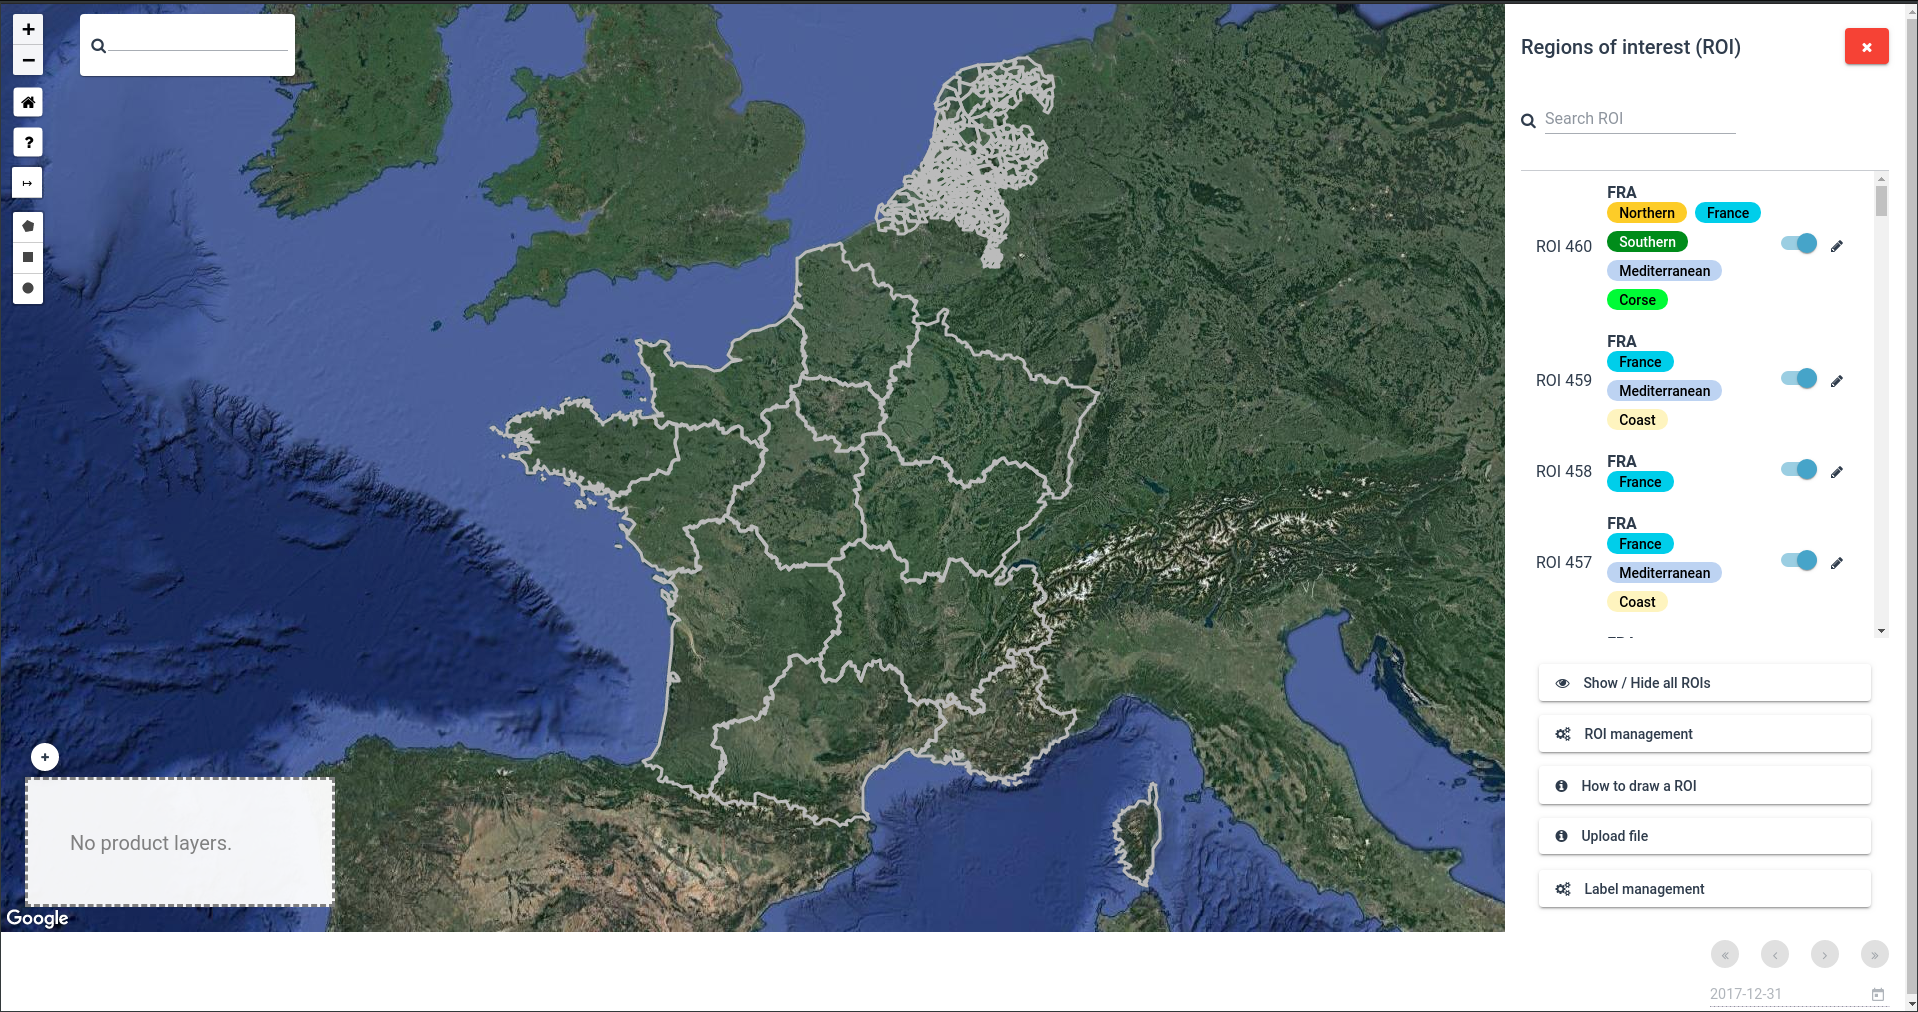
The region of interest (ROI) menu can be found on the top right of the screen,
just below the settings menu (where you can change the base layer from satellite
to terrain, openstreetmap, etc.).
Figure showing the main components of the Planetary Variables viewer including
the ROI menu at the top right
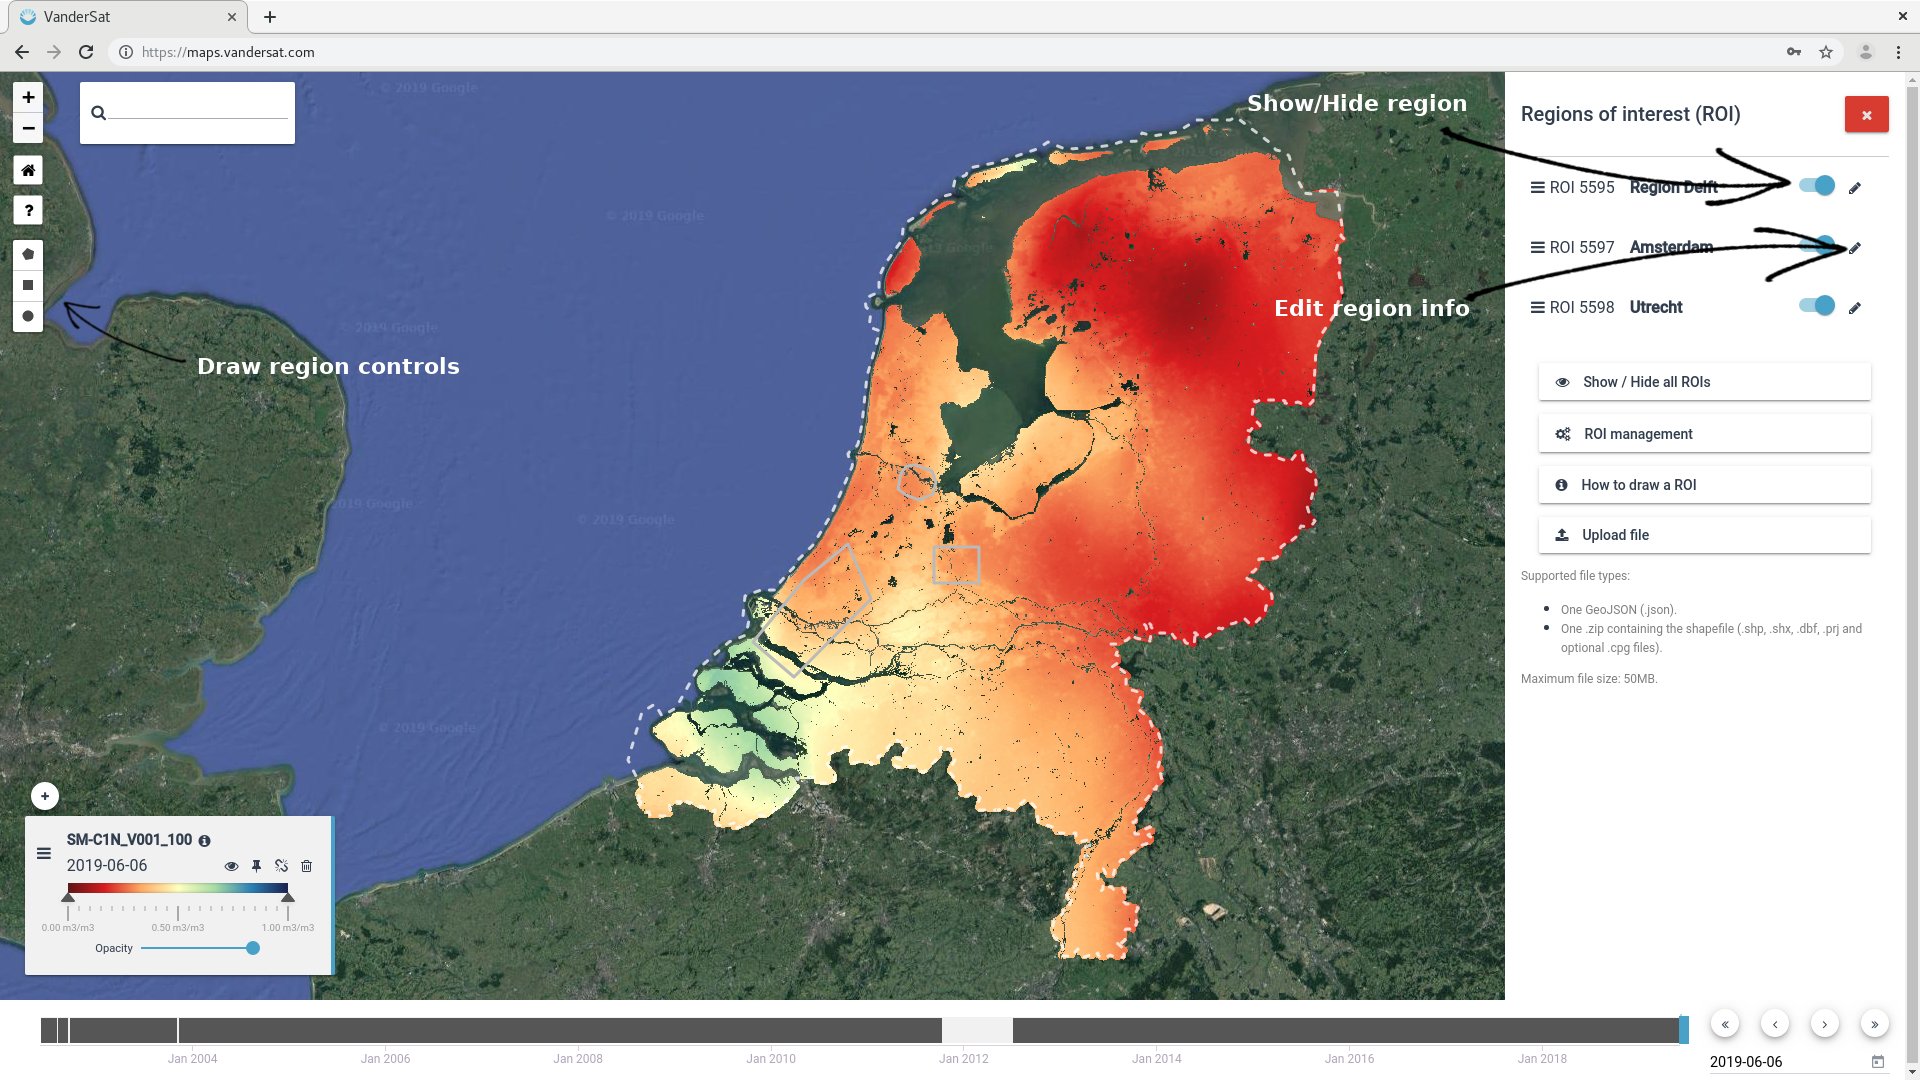
All defined ROIs are displayed in this menu. You have the option to show a
specific one, or hide/show all of them. To create a new ROI, you can either
draw one manually or upload a shapefile (GeoJSON format or zip archive
containing the required files).
Figures showing the Planetary Variables ROI menu. Regions can be switched on
or off, new regions can be defined (uploaded or drawn) and edited.
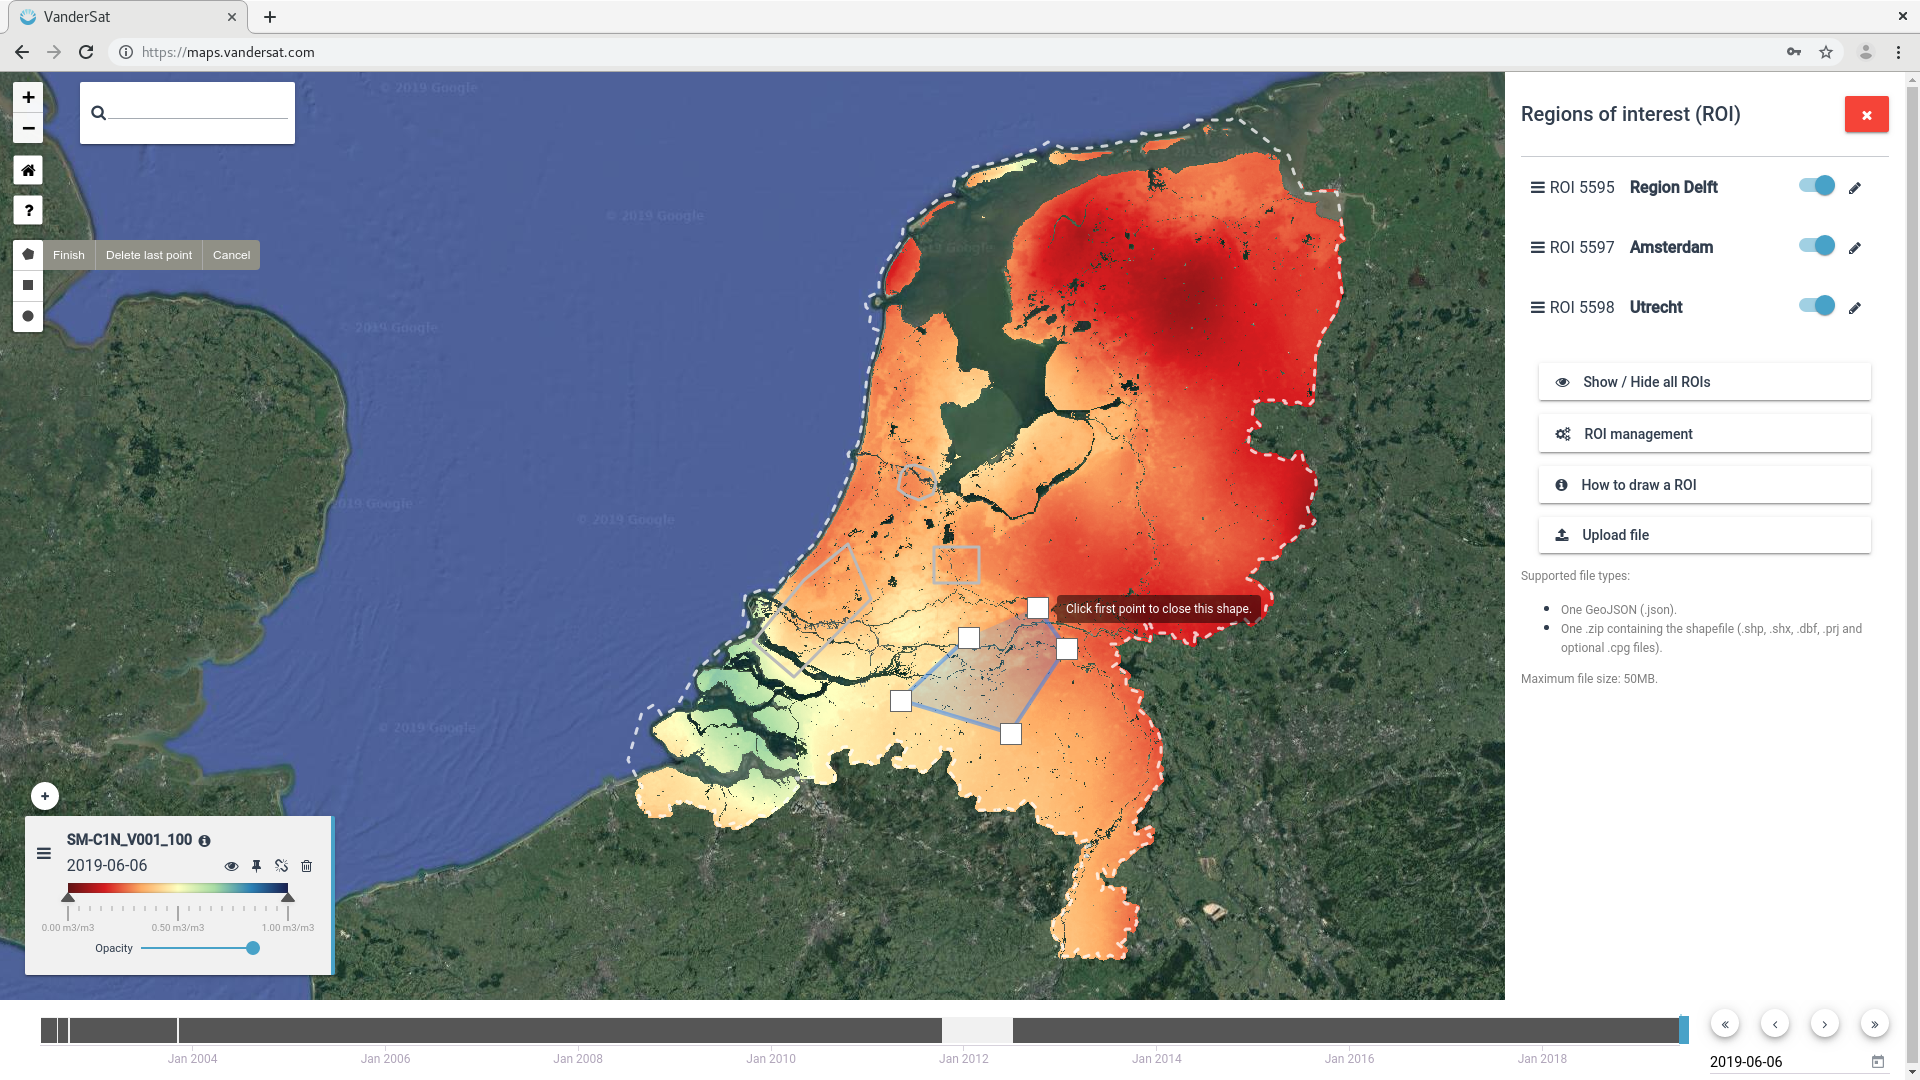
Using the controls on the left a new region can be created on the by drawing it
on the map.
Figures showing the Planetary Variables viewer ROI drawing
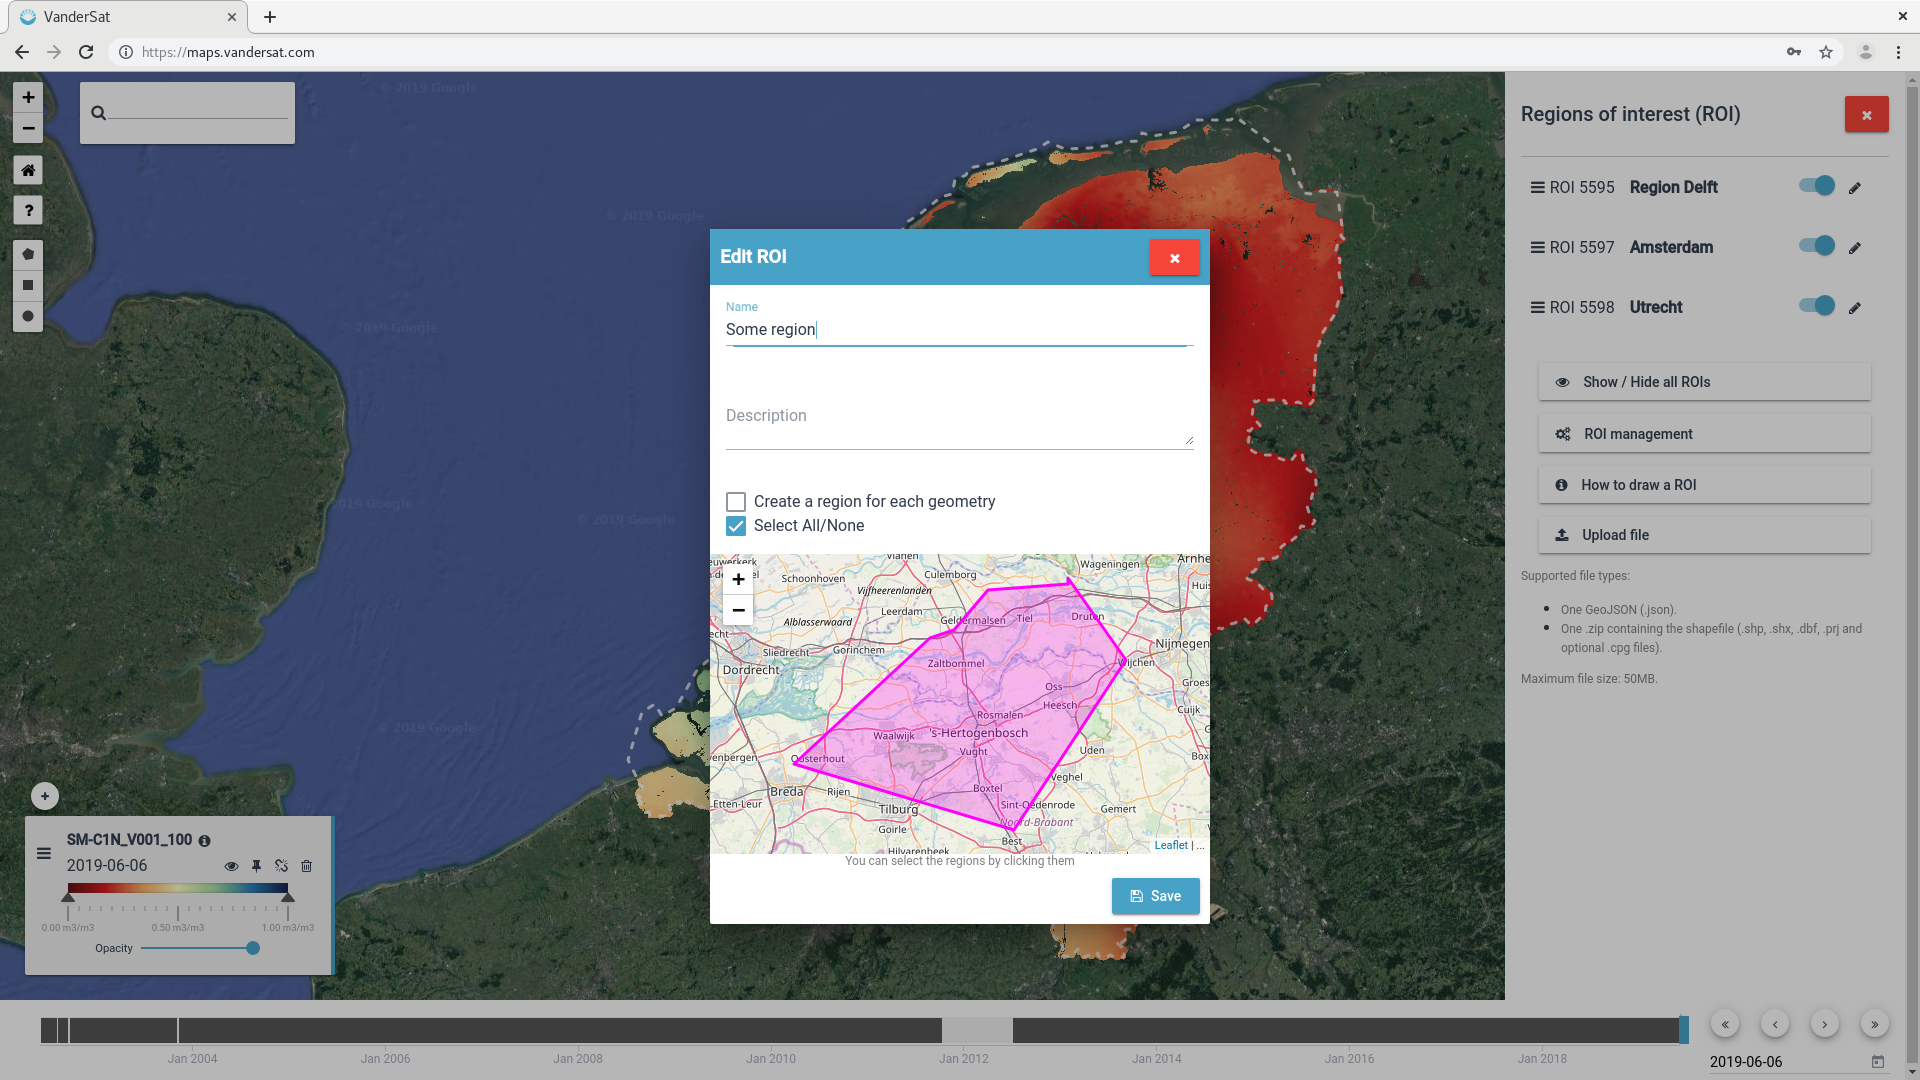
Once uploaded, the new ROI can be customised with a name and a description.
Please note that for multipolygon shapefiles (ie multiple shapes in a file), you
have the option to select a subset of them and/or to consider them as different
ROI or a single one as the union of those multiple shapes.
Figure showing the edit/upload menu for ROI’s in the Planetary Variables
viewer
Once a new ROI is created, the map is centered over this ROI and the
current selected layer is shown.
Please note that when a new ROI is for the first time added (drawn
or uploaded), it takes a few hours to initialize the complete
historical dataset corresponding to this ROI and update the
dashboard time series and KPI values.
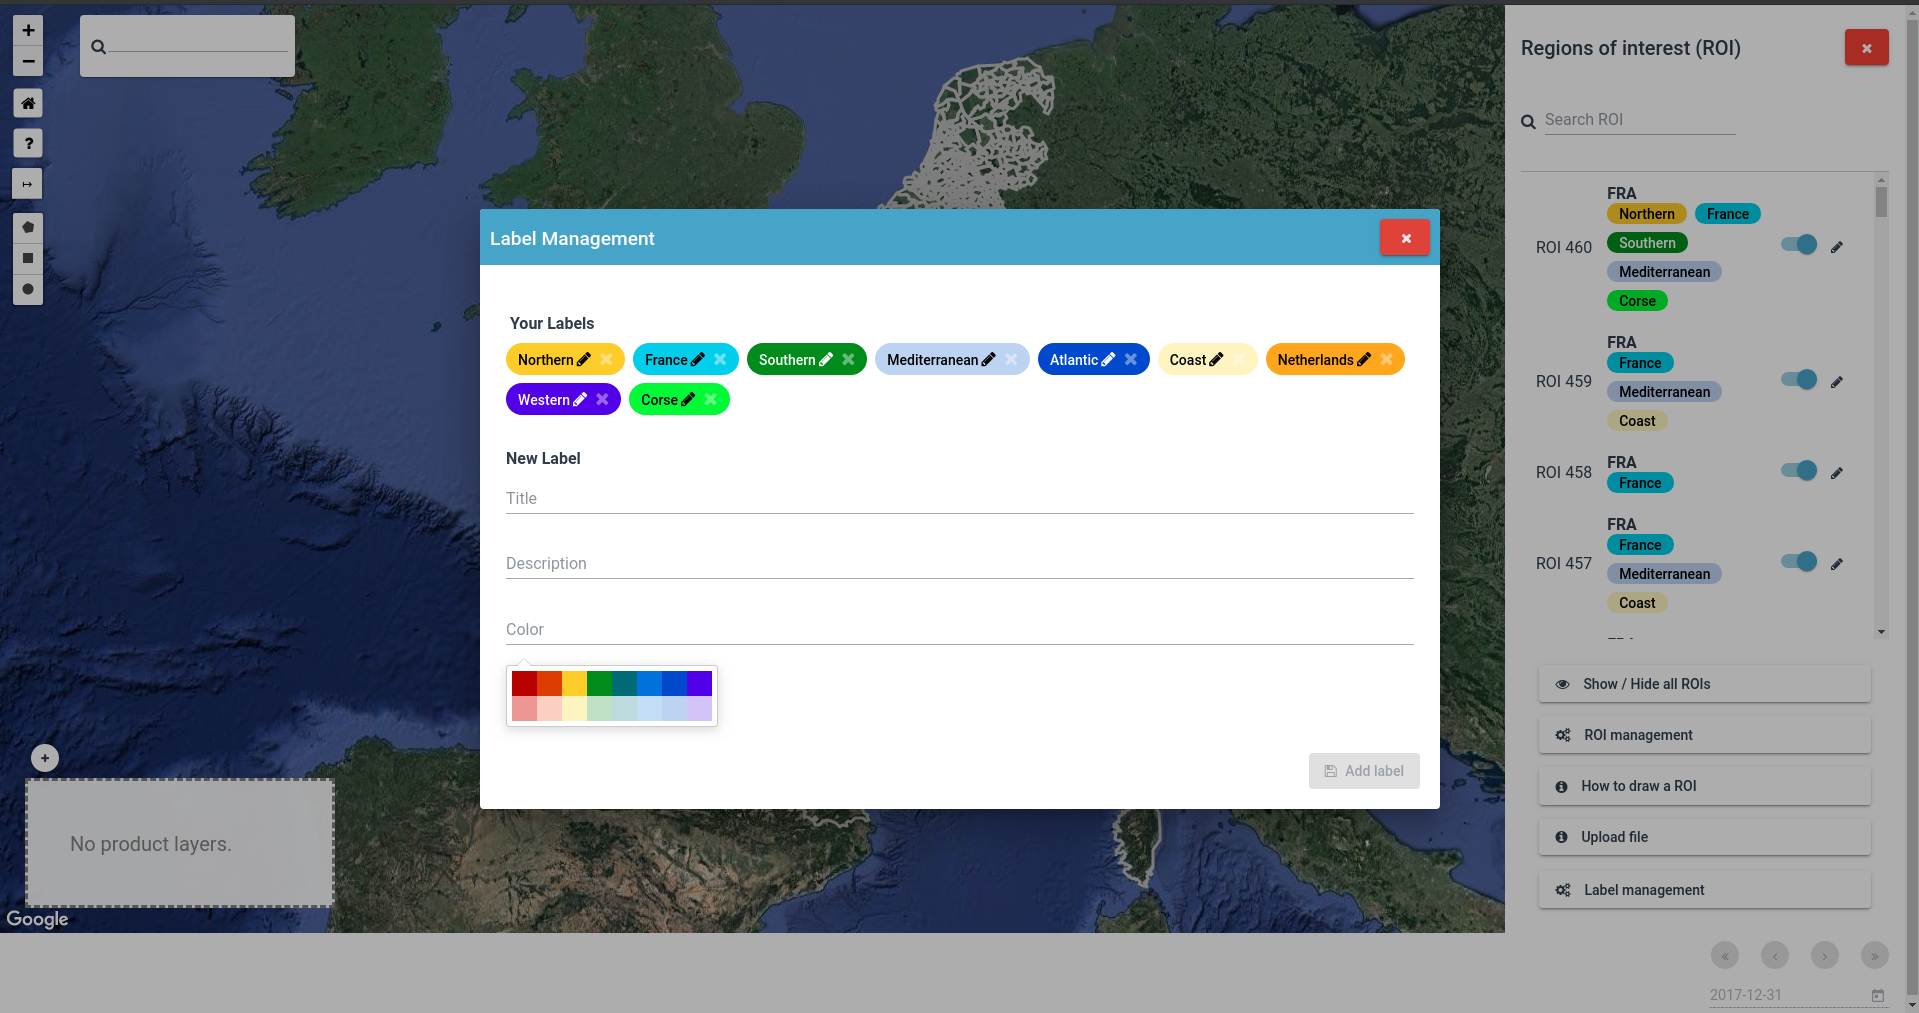
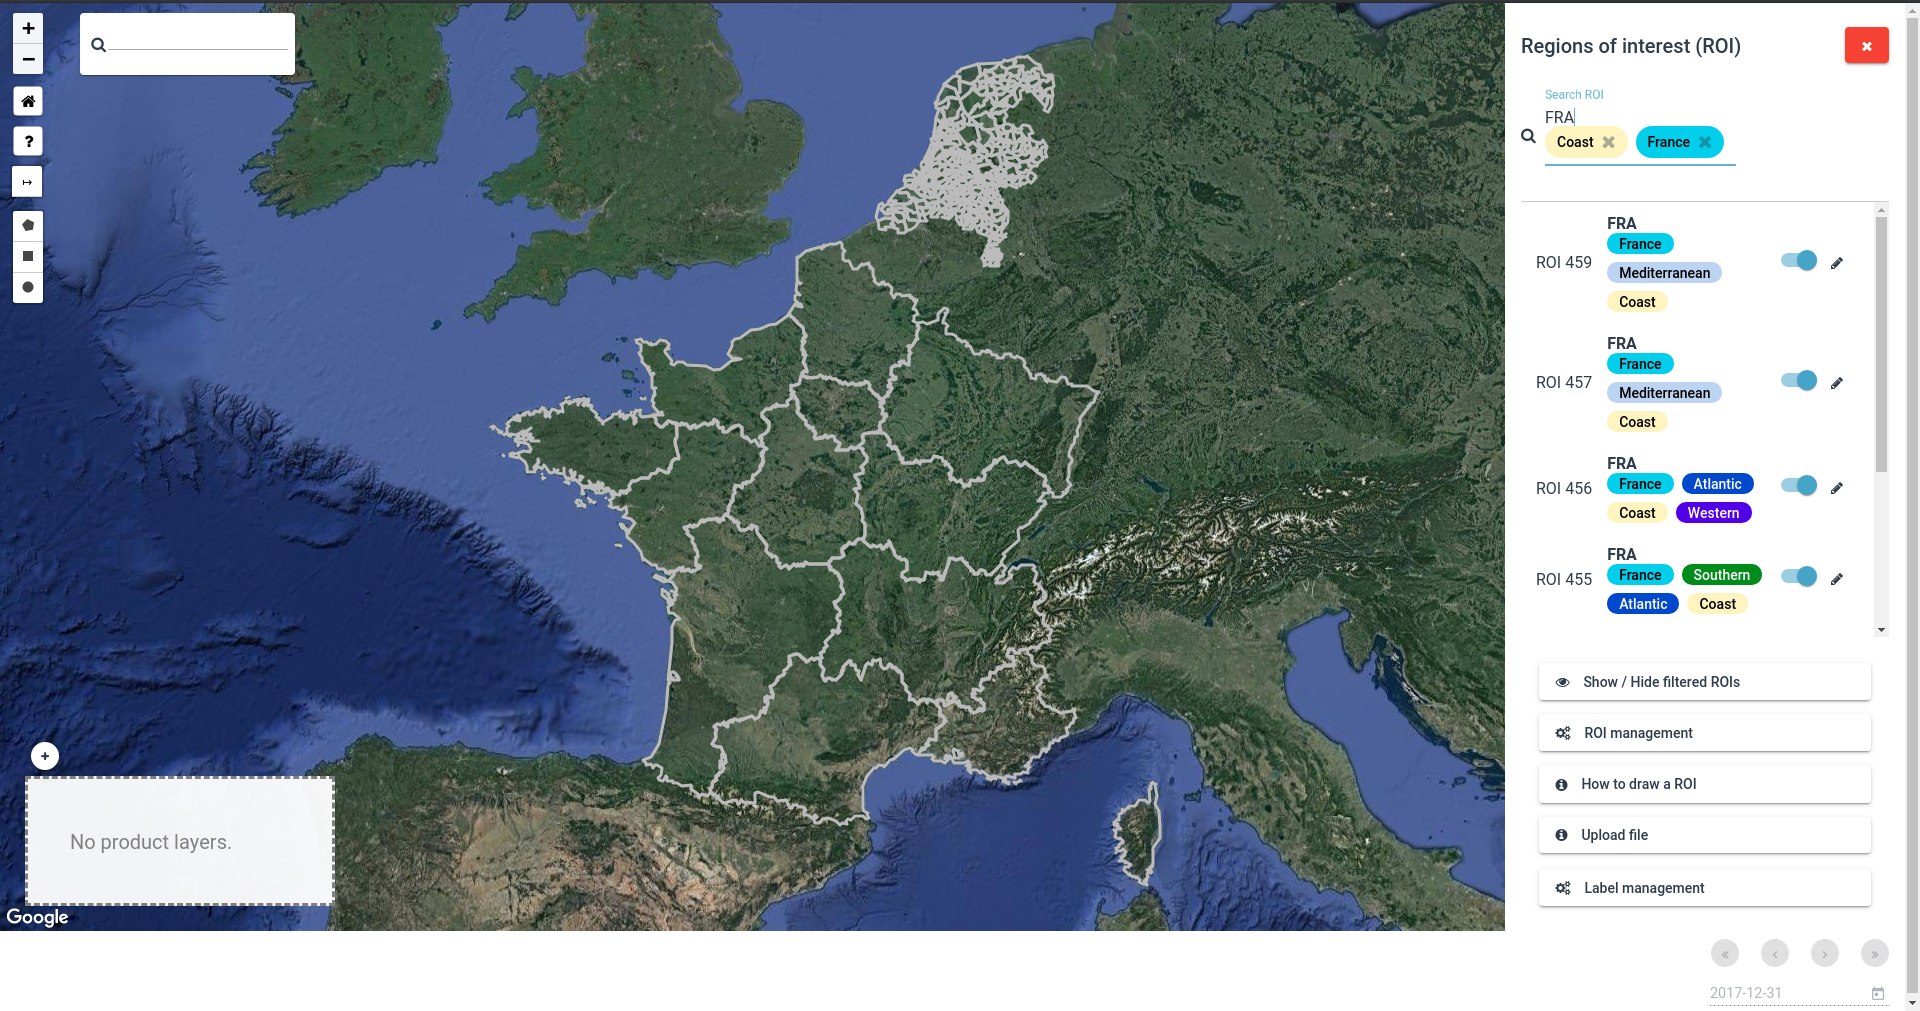
The regions of interest can be tagged using labels which you can create and customize.
Those labels can then be used with the ROI search for filtering purposes.
Whenever you have a filter applied, the ROI list is reduced to the matching results.
Those resultant ROIs can be shown/hidden in the map by clicking the “Show/Hide filtered ROIs” button below the list.
This action won’t affect to visibility of the ROIs not present in the filtered ROI list.
You can download part of the current data layer as a GeoTIFF to your local computer.
To do so go to the API access meu and choose the “Download map” button under the
Exports heading. A rectangle will appear that can be changed in size to select
an area. Press save once the required area is selected.
Downloading a data layer as a GeoTIFF in the viewer
This will create an API request that, when the is Ready you can download the
resulting GeoTIFF for that request accessing it from the API access menu in the
“Recent API requests” list, or in the list shown after clicking the “API Request
management” button.
Downloading a data layer as a GeoTIFF in the viewer
Using the share button you can generate a URL that can be used by others (or
yourself later on) to see the exact same view. You will need a login to the
viewer in order to use the URL and permissions to view the selected products.
Checking the Latest date option in the dialog show a map with the
latest info available whenever the share link is used.
Clicking the arrow control on the left enables the measurement tool controls.
Adding points: single click. (to measure the distance between them. The total
distance accumulated is shown in the last point).
Stop measuring: double click, escape key, or click again the arrow control on
the left.
Clear current measurements shown: click the [x] right under the arrow control
on the left.
Change measure unit: click the third control with a letter under the arrow
control on the left. Units available: meters (m), miles (mi), nautical miles
(nm).
A point can be moved once its placed via drag and drop or “picking it up” with a
single click, then place it again with a another single click. A point can be
removed via clicking on it while pressing the shift key. A measurement can be
continued via clicking on the last point while pressing the ctrl key.
Once the measurement tool is disabled, the data will be kept on the map. But
enabling it again will clear them.
Note
The measurement tool will always take the shortest line from one point to the next.