Background
Planet offers an inundation service based on Sentinel-1 data for The Netherlands. The service is based on the fact that open water usually has a distinct signal in C band radar.
Depending on the location there are about 180 images per year available. For a given area a new inundation map is generated for each overpass of the satellite.
Basic description of the method
The algorithm uses the following steps:
Raw backscatter images are scaled to increase the water/land contrast
A rolling mean is calculated for the VV and VH polarizations separately
The current image (VV and VH separately) is compared to the rolling mean and based on thresholds different classes are set
After filtering a final map is created
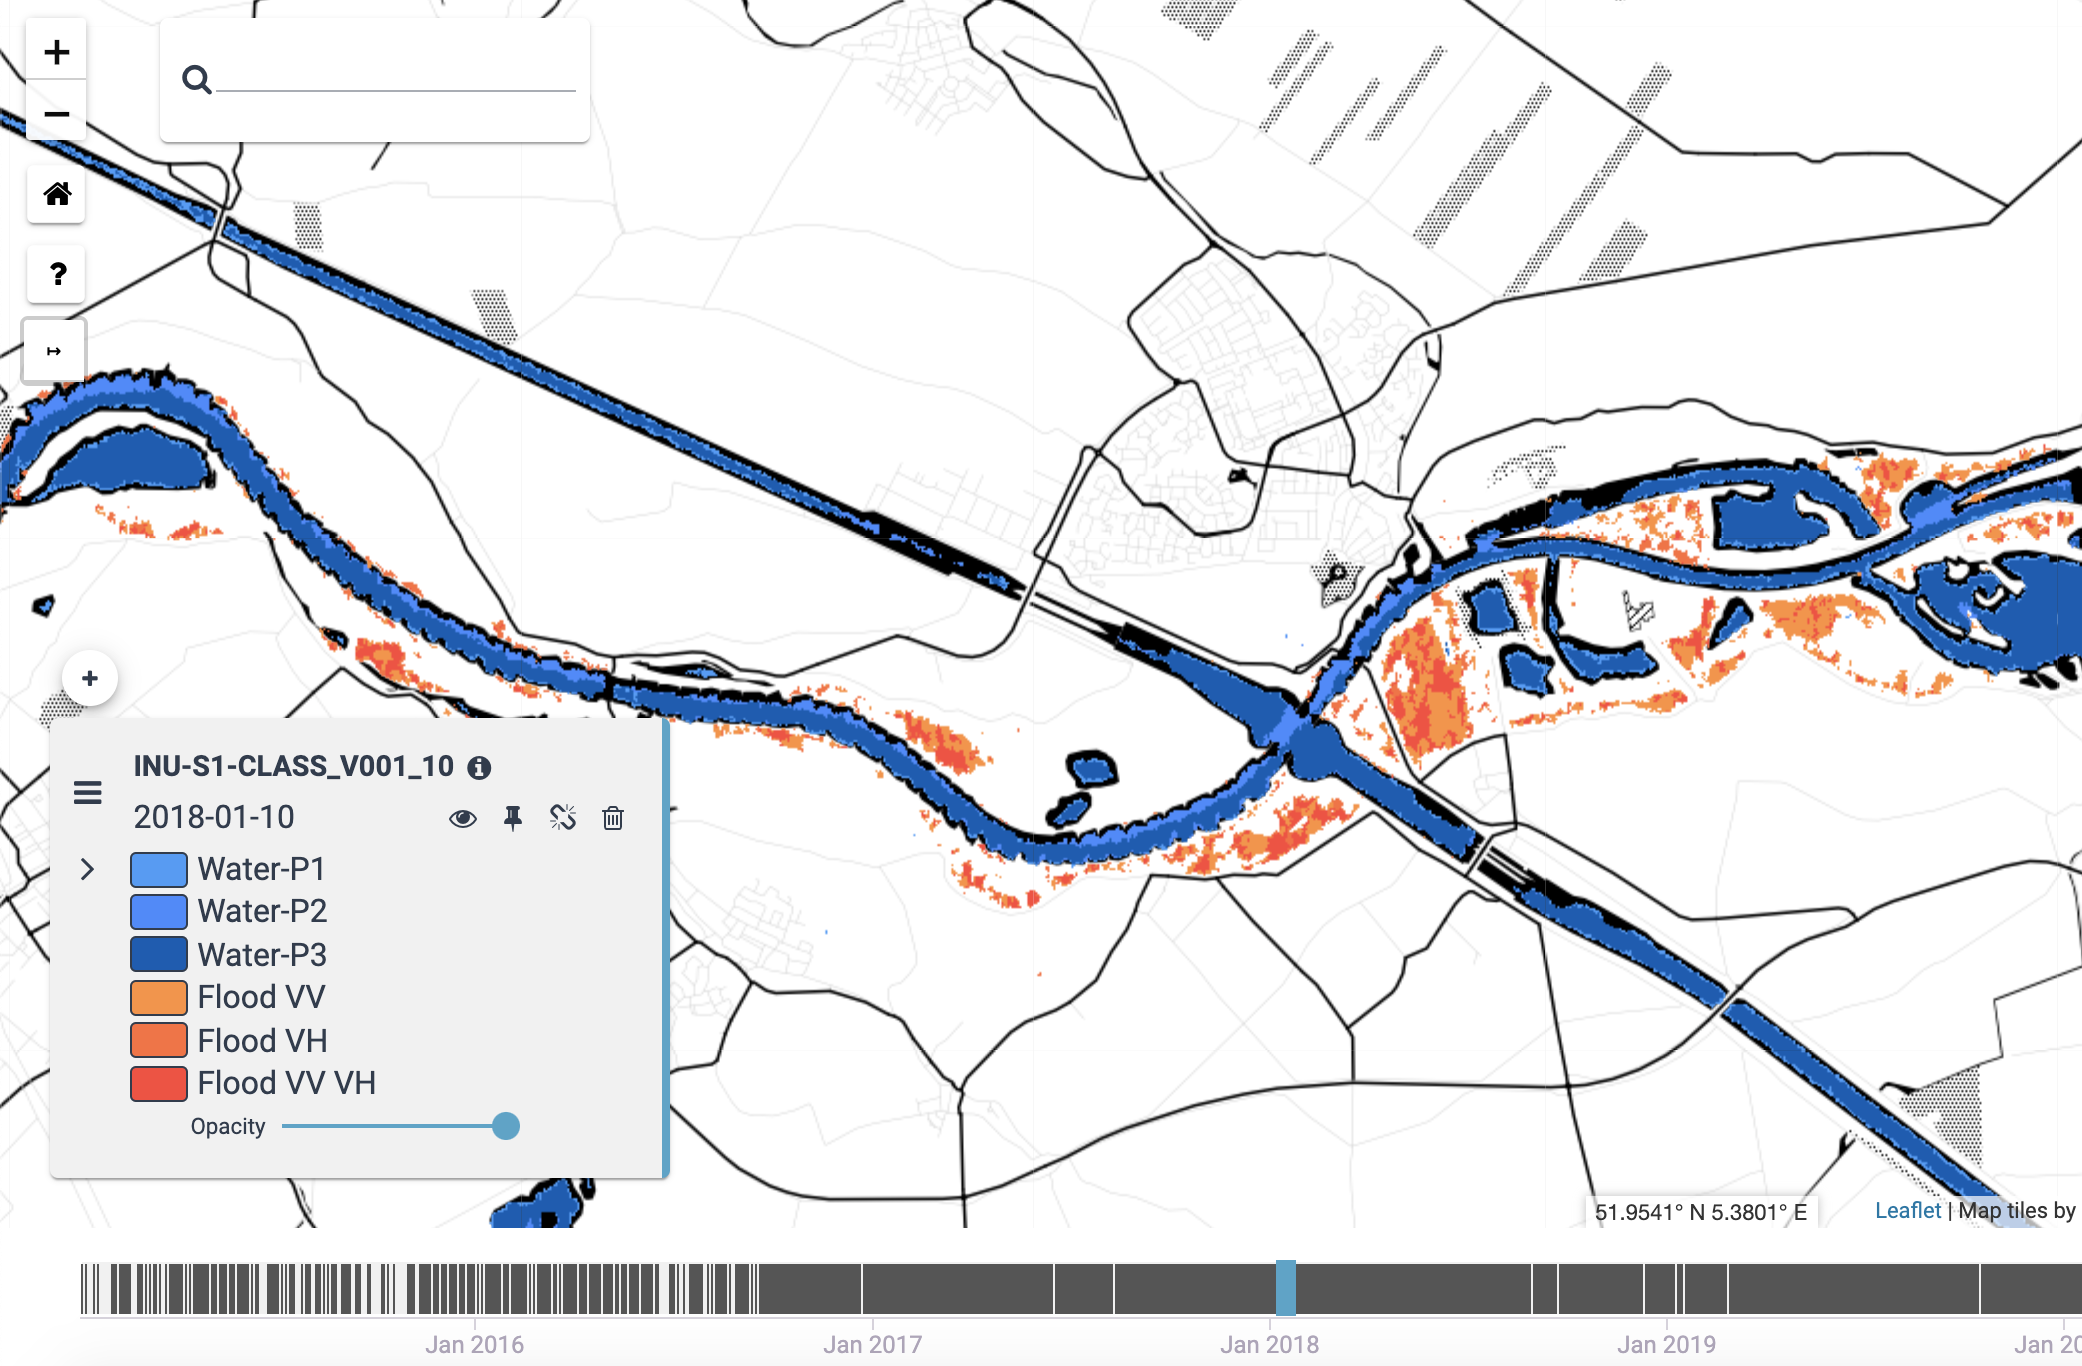
Example of a generated inundation map. Blue areas are detected as permanent water, red/orange areas as flooded. The intensity of the color indicates the level of certainty.
A description of a validation study that has been undertaken in the southern part of The Netherlands can be found in [dNdJSP17] (in Dutch).
Bibliography
Anne de Nijs, Richard de Jeu, Arnoud Soetens, and Arjan Peters. Wateroverlast in kaart gebracht met satellieten. H2O, 6:10, 2017. URL: https://library.wur.nl/WebQuery/hydrotheek/2223191.